

See Your Business in Real Time
Connect your ERP, CRM, accounting, and spreadsheet data into one live dashboard. Every metric updates automatically and traces back to the system it came from.
50+ ERP and software projects. Zero failed projects since 2021.
Decisions that wait on someone exporting a spreadsheet
When revenue lives in one system, usage lives in another, and support tickets live in a third, nobody has the full picture without manually pulling several exports and reconciling them by hand.
A business intelligence dashboard replaces the manual export cycle
That delay shows up as slower decisions and numbers that are already stale by the time they reach a meeting. A connected dashboard closes that gap by pulling from the same systems automatically, on a schedule nobody has to remember.
- ERP, CRM, and spreadsheet data pulled into one place.
- No manual export and reconcile cycle before every meeting.
- Numbers stay current instead of stale by the time they are seen.
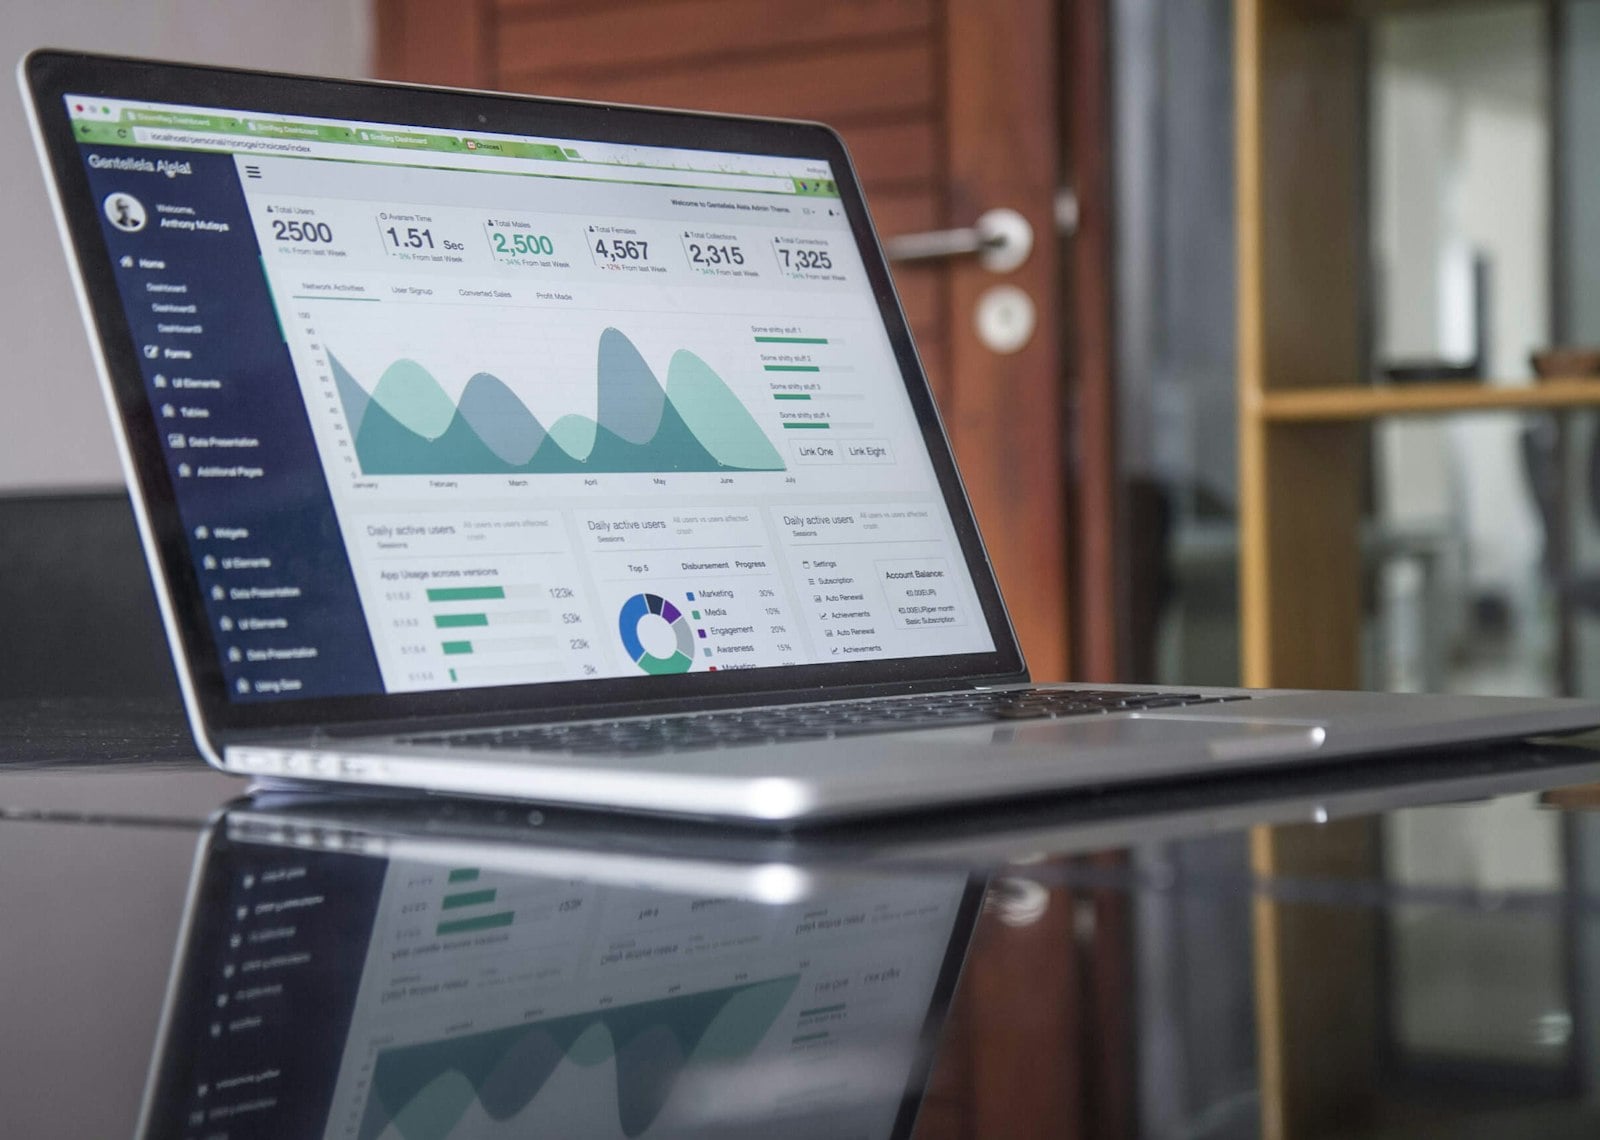
A live view replaces the report someone used to build by hand
Once a dashboard is connected to your source systems, the weekly or monthly report that used to take someone a day to assemble is available on demand, and it reflects data as of now rather than as of the last manual pull.
- Metrics update automatically as source data changes.
- One dashboard replaces several recurring manual reports.
- Every number is traceable back to its source system.

Every metric traced back to its source system
Illustrative example dashboard. Your actual metrics and layout depend on the data sources you connect.
From scattered data to a validated dashboard your teams use daily
Everything needed to run a live dashboard in production
Data source connections
ERP, CRM, accounting, and spreadsheet data connected into one dashboard.
Role based access
Each team sees the metrics relevant to their role, nothing more.
Real time refresh
Dashboards update automatically as source data changes, with no manual refresh.
Custom metric calculations
Metrics defined to match how your business actually calculates them.
Exportable reports
Any view can be exported for a meeting or a stakeholder who needs a static copy.
Ongoing support
Dashboards adjusted as your data sources or reporting needs change.
What a business intelligence dashboard changes day to day
Why teams build dashboards with TCB Infotech
Business Intelligence Dashboards, answered
What is a business intelligence dashboard, and how is it different from a report?
What data sources can feed into the dashboard?
How long does it take to launch a first dashboard?
Who can access and edit the dashboards after launch?
Can dashboards connect to our existing ERP or accounting system?
What happens if our data structure changes later?
Start Seeing Your Business in Real Time
A dashboard only earns its place if it replaces a report someone used to build by hand. Book a free consultation and bring the metrics you currently track manually, and we will show you what a connected view of that data looks like.
Book a Free Consultation →No commitment. See a working example before you decide.
How Business Intelligence Dashboards Are Built
From mapped data sources to a validated, role based dashboard your teams use daily. Here is the process behind every dashboard we build.
Mapping, design, and validation, in that order
Every source system identified before any screen is designed
We list every system that holds a number your business tracks today, from your ERP to the spreadsheets someone maintains by hand, and confirm which fields feed which metric.
- All data sources catalogued up front.
- Data quality checked before it is connected.
- Access requirements confirmed for each source.

Calculations agreed on before they are built
Every metric on the dashboard is defined and agreed with you first, so the numbers match how your business actually calculates them rather than a generic default.
- Metric definitions confirmed with stakeholders.
- Layout designed around how each team works.
- Access roles planned before build starts.

Connected, checked against source, then rolled out by role
Each source is connected and every figure is checked against the original system before the dashboard goes live. Access is then rolled out by role, with a short walkthrough for each team.
- Every metric validated against its source.
- Role based access configured before launch.
- Each team walked through their own view.
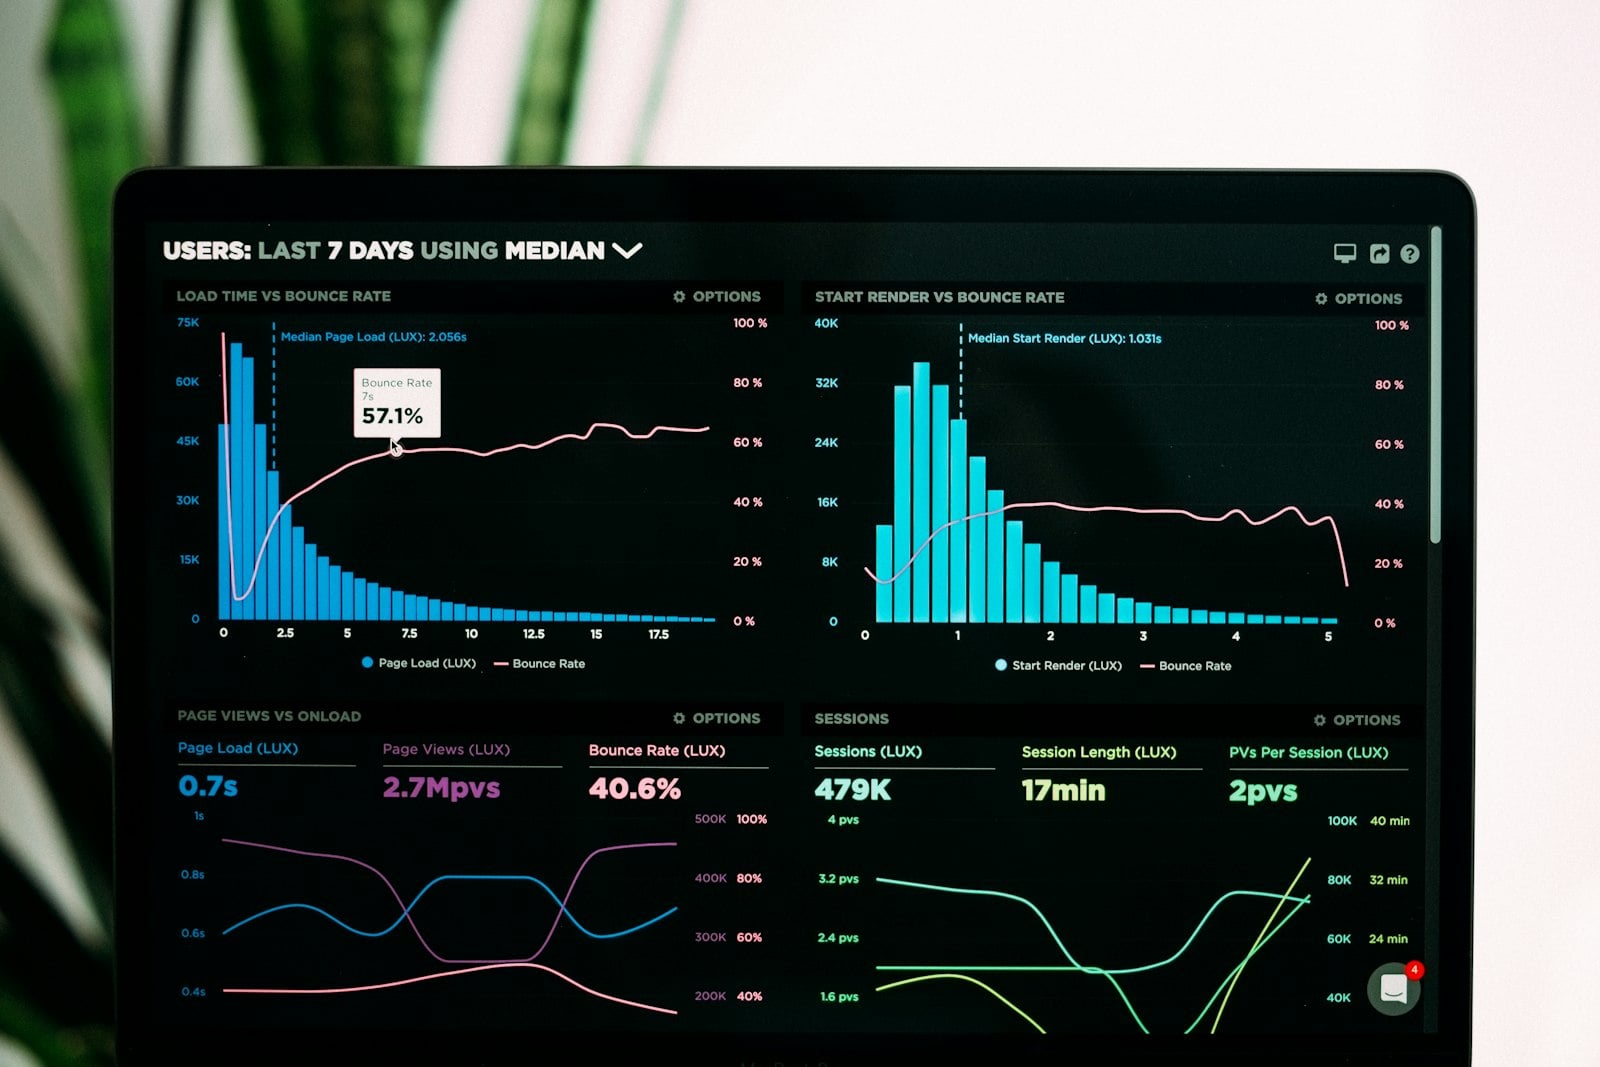
Everything included in the engagement
Data source connections
ERP, CRM, accounting, and spreadsheet data connected into one dashboard.
Role based access
Each team sees only the metrics relevant to their role.
Real time refresh
Dashboards update automatically as source data changes.
Custom metric calculations
Metrics defined to match how your business calculates them.
Exportable reports
Any view can be exported for a meeting or stakeholder update.
Ongoing support
Dashboards adjusted as data sources or reporting needs change.