

Measured, Not Guessed Performance Gains
Profiling and improving the performance of an existing application or infrastructure: slow pages, slow queries and high resource usage, with before and after benchmarks for every change.
50+ ERP and software projects. Zero failed projects since 2021.
Guessing at a performance fix wastes the effort spent applying it
A change that is not measured against a real before number can look like an improvement without actually being one. Profiling first keeps every fix tied to a number that moved.
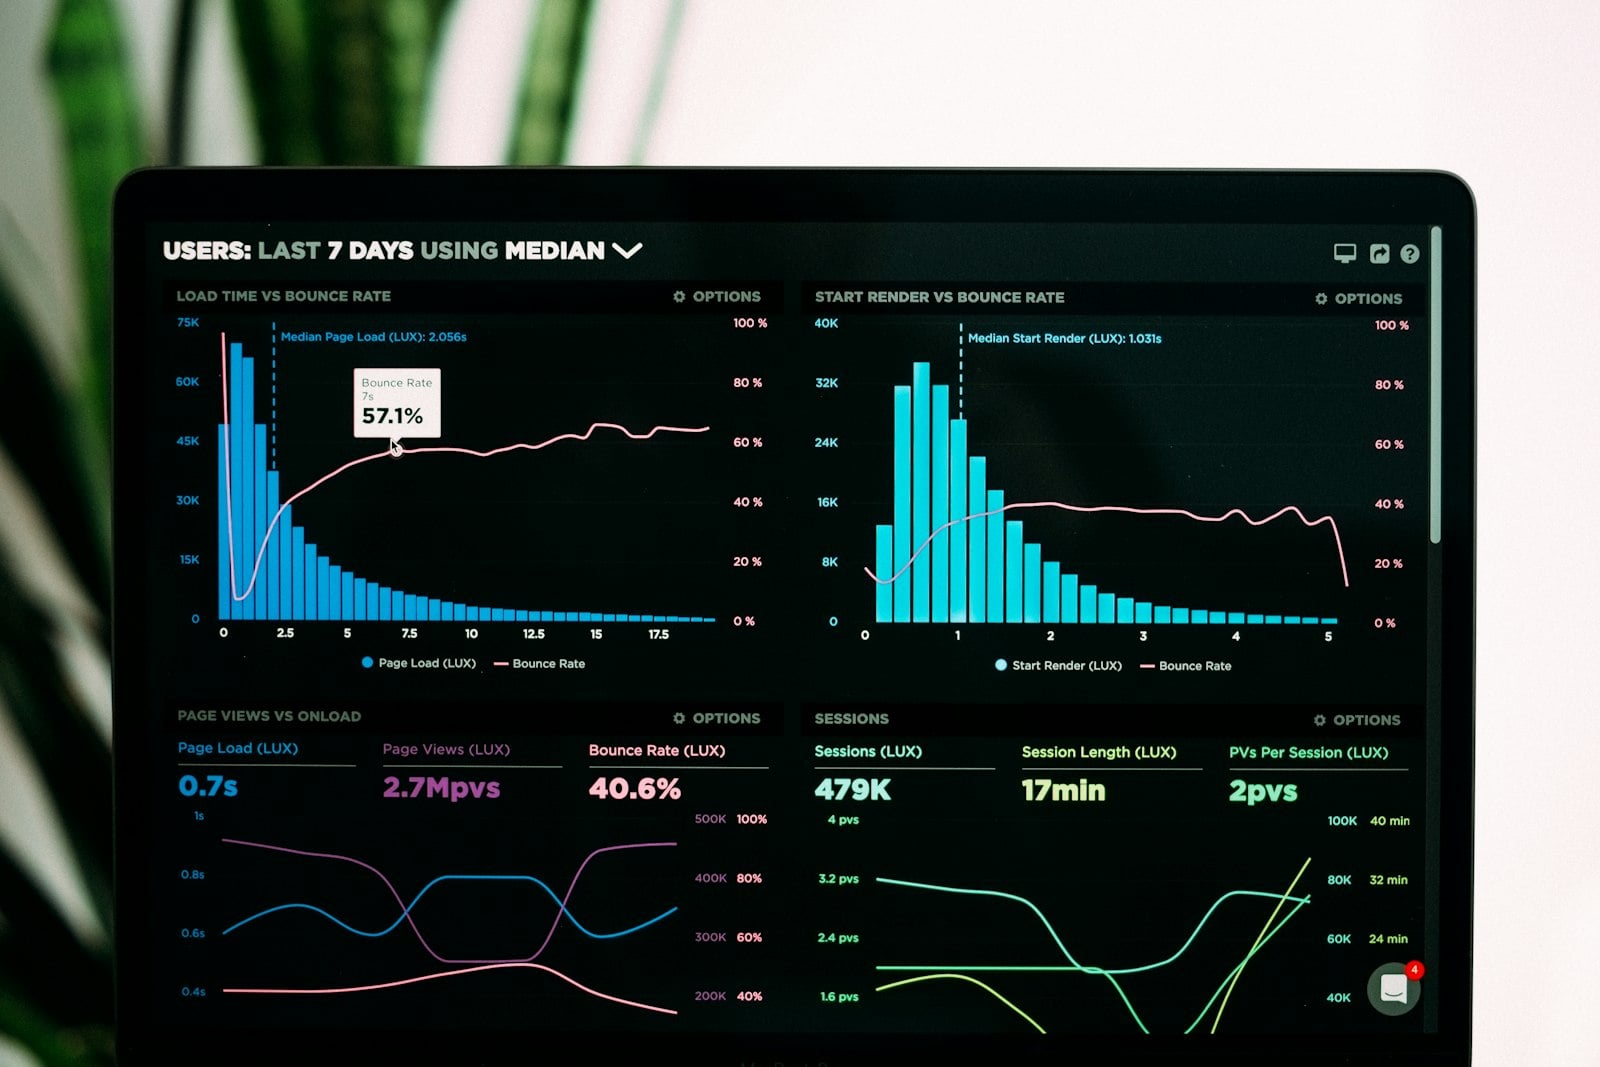
Finding where time is actually being spent
Before changing anything, we profile page loads, API calls and database queries to see exactly where time and resources go, instead of guessing at the likely cause.
- Profiling across pages, APIs and queries.
- Bottlenecks identified with data, not assumptions.
- A clear before benchmark for every area in scope.
Query tuning, caching and configuration, not a rewrite
Most gains come from targeted changes such as indexing, caching and configuration fixes, applied to the specific bottleneck the profiling identified.
- Fixes scoped to the actual bottleneck.
- No full rewrite of the application.
- Every fix measured with an after benchmark.

Every fix tied to a before and after number
Illustrative example. Your actual benchmarks depend on the application, infrastructure and workload profiled.
From a profiling pass to a measured, benchmarked fix
Everything needed to profile and improve performance
Application profiling
Page load and API response times measured to find the actual bottleneck.
Query profiling
Slow queries identified and measured against their execution cost.
Targeted fixes
Indexing, caching and configuration changes scoped to the bottleneck found.
Before and after benchmarks
Every fix measured against a recorded before number under the same conditions.
Resource usage review
CPU, memory and connection usage checked under realistic peak load.
Benchmark report
A clear report handing over what changed and what it measurably improved.
What Performance Optimization changes for a slow application
Why teams use Performance Optimization through TCB Infotech
Performance Optimization, answered
What kind of performance problems do you work on?
Do I need to already know what is slow?
How do you measure improvement?
Will this involve rewriting the whole application?
How long does an optimization engagement take?
What happens after performance is improved?
Turn Slow Into Measured
Stop guessing at what is slow. Book a free consultation and we will start with a profiling pass on the areas that matter most.
Book a Free Consultation →No commitment. See the before number before any fix begins.
How Performance Optimization Works
From a profiling pass to a measured, benchmarked fix. Here is how we find and resolve slow pages, slow queries and high resource usage.
Profiling, fixing and benchmarking, in that order
Finding where time and resources are actually spent
We profile page loads, API calls and database queries under realistic conditions to identify the real bottleneck before changing anything.
- Profiling across pages, APIs and queries.
- Bottlenecks identified with data, not assumptions.
- A recorded before benchmark for every area in scope.
Indexing, caching and configuration changes
Fixes are scoped to the specific bottleneck the profiling identified, whether that is a missing index, a cache miss or a configuration limit.
- Fixes scoped to the actual bottleneck.
- No full rewrite of the application.
- Changes reviewed before rollout.

A measured after number, not an estimate
Performance is measured again under the same conditions as the original benchmark, and the before and after result is handed over in a clear report.
- Re-benchmarked under comparable conditions.
- Before and after results shown side by side.
- A report you can share internally.
Everything included in the engagement
Application profiling
Page load and API response times measured to find the bottleneck.
Query profiling
Slow queries identified and measured against execution cost.
Targeted fixes
Indexing, caching and configuration changes scoped to the bottleneck.
Before and after benchmarks
Every fix measured against a recorded before number.
Resource usage review
CPU, memory and connection usage checked under peak load.
Benchmark report
A clear report handing over what changed and what improved.